
Find and characterise RF signals
A spectrum analyser shows what is present across a frequency range — carriers, spurs, harmonics and noise that an oscilloscope cannot separate in the time domain. Our current range covers 9 kHz to 3.2 GHz with resolution bandwidth down to 1 Hz, and an optional tracking generator for scalar network measurement.
Our spectrum analyser
One series at present, in two build states: with the tracking generator fitted, or without.
GPS-SA3000X series
A bench analyser built on an all-digital IF, with a 20 dB preamplifier fitted as standard, four independent traces and markers, and a 10.1″ WVGA display. Resolution bandwidth runs from 1 Hz to 1 MHz, which separates carriers a few hertz apart rather than merging them into one peak.
The tracking generator can be ordered factory-fitted or added later as a kit. EMI pre-compliance, reflection and advanced measurement kits extend it to CISPR 16 quasi-peak testing, VSWR and return loss, and channel power and ACPR.
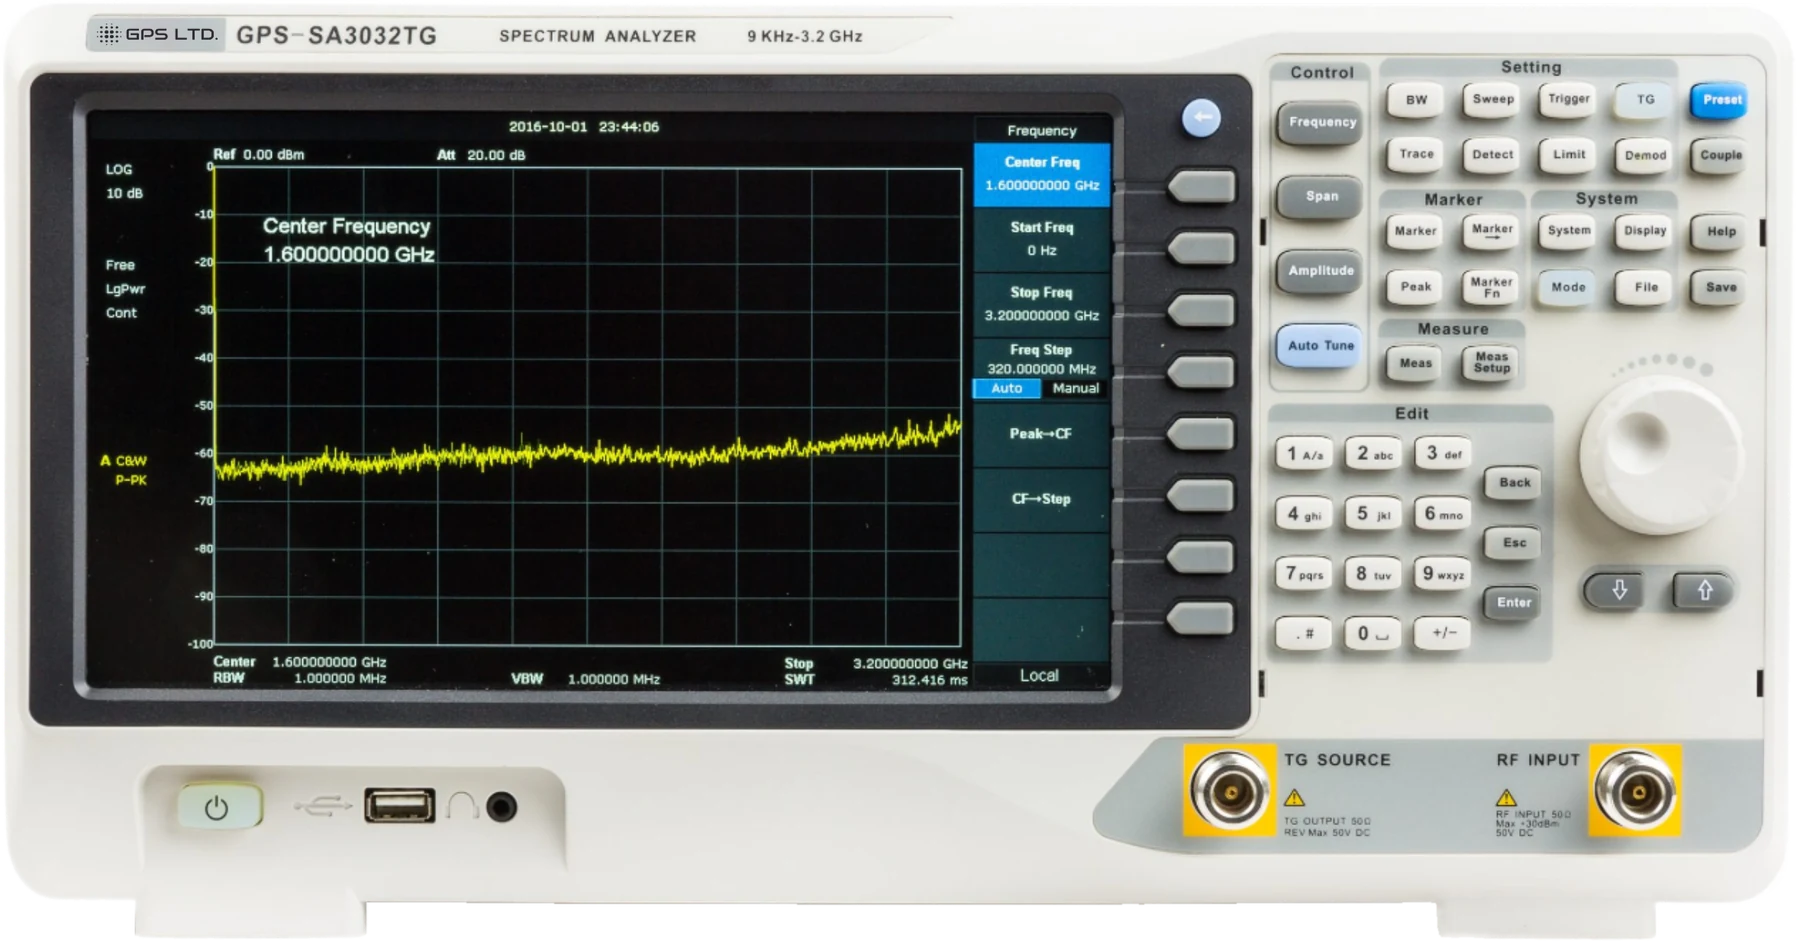
| Model | Frequency Range | Tracking Generator | RBW | DANL | Display | Part No. | Product page link |
|---|---|---|---|---|---|---|---|
| GPS-SA3032X | 9 kHz – 3.2 GHz | Not fitted | 1 Hz – 1 MHz | −161 dBm/Hz | 10.1″ WVGA | 630320 | View series → |
| GPS-SA3032TG | 9 kHz – 3.2 GHz | Fitted 100 kHz – 3.2 GHz | 1 Hz – 1 MHz | −161 dBm/Hz | 10.1″ WVGA | 650530 | View series → |
Option kits: tracking generator TG-SA3000 (900355) · EMI measurement EMI-SA3000 (900109) · advanced measurement AMK-SA3000 (900382) · reflection measurement REFL-SSA3000 (900183) · soft carrying bag BAG-SCC (900362).
Three questions that decide it
Frequency range is the obvious one. These are the specifications that decide whether an analyser can actually do your job.
How far up do you need to go?
Frequency range sets the ceiling, and there is no working around it. 3.2 GHz covers the 2.4 GHz ISM band, Bluetooth and Wi-Fi, most mobile allocations and the harmonics of anything well below that. Work above roughly 3 GHz — 5 GHz Wi-Fi, or radar — needs a different class of instrument.
How small is the signal?
Displayed average noise level sets the smallest signal you can see. Anything at or below the floor is indistinguishable from the noise. −161 dBm/Hz normalised to 1 Hz with the preamplifier on gives real margin on weak spurs and low-level emissions, where a floor 20 dB higher would hide them entirely.
Do you need to stimulate, or just observe?
Without a tracking generator an analyser can only show signals that already exist. Add one and it sweeps a source in step with the receiver, which measures the frequency response of filters, amplifiers, cables and antennas. If you expect to characterise passive parts as well as find signals, order it fitted.